PhD Opportunities in HCI and Learning Analytics @ Monash, Melbourne, Australia
Human-Centred Multimodal Teamwork Analytics (SCHOLARSHIP AVAILABLE, commencing in 2021)
This scholarship will provide a stipend allowance of $29,000 AUD per annum for up to 3.5 years, plus $4,000 travel allowance. If you are currently in Australia you are strongly encouraged to apply. If successful, you will join Prof. Dragan Gasevic, me, and a strong team of academics, researchers and other students at the Centre of Learning Analytics at Monash University (https://www.monash.edu/it/dsai/learning-analytics), Melbourne.
We are seeking PhD candidates interested in developing methods to assist the formative assessment and improvement of collocated teamwork, by making multimodal activity traces visible and available for computational analysis. This learning analytics project will be conducted in the context of simulation-based healthcare education, and it will support the development of effective strategies to improve teamwork and communication skills in healthcare.
You will use sensor-technology to capture multimodal ‘trace’ data including gestures, speech, workspace spatial layout and manual handling of objects. You will then link these with high-order constructs related to high-performance teamwork, such as effective communication, coordination and leadership. This will assist the assessment and improvement of collocated teamwork, that is, work conducted where team members share the same physical space.
Depending on the trajectory that you take, examples of the research goals that such a project could investigate include:
1. Identify a novel co-design methodology along with the structural templates that could be used to drive the further design process of collocated teamwork analytics with critical educational stakeholders.
2. Propose and evaluate a methodology to map out multimodal sensor data into higher-order constructs to enable for measurement of relevant learning qualities of skills and progression of learners as they develop.
3. Develop and evaluate a presentation paradigm to enable non-data science savvy users to get actionable insights into the findings obtained through the measurement framework introduced above.
Skills and dispositions required:
- A Masters degree, Honours distinction or equivalent with at least above-average grades in computer science, mathematics, statistics, or equivalent
- Analytical, creative and innovative approach to solving problems
- Strong interest in designing and conducting quantitative, qualitative or mixed-method studies
- Strong programming skills in at least one relevant language (e.g. C/C++, .NET, Java, Python, R, etc.)
- Experience with data mining, data analytics or business intelligence tools (e.g. Weka, ProM, RapidMiner). Visualisation tools are a bonus
It is advantageous if you can evidence:
- Experience in designing and conducting quantitative, qualitative or mixed-method studies
- Familiarity with educational theory, instructional design, learning sciences or human-computer interaction/CSCW
- Peer-reviewed publications
- A digital scholarship profile
- Design of user-centred software
Apply to this opportunity by sending your CV and bachelor/master transcripts by email to Roberto@MartinezMaldonado.net
I would also be happy to accept students interested in working in projects similar to the PhD Opportunities listed below. Ask for scholarship opportunities and the application process by sending me an email to Roberto@MartinezMaldonado.net
Opportunity 1: Data Storytelling with learning data
I am seeking PhD candidates interested in working on designing Learning Analytics or similar reflection interfaces that automatically highlight design elements of data visualisations and generate narrative to communicate insights (instead of just plotting data).
The challenge for this PhD is to research, prototype and evaluate approaches to increase the explanatory effectiveness of the visualisations contained in learning analytics or similar support tools. Explanatory visualisations are those whose main goal is the presentation and communication of insights. By contrast, exploratory visualisations are commonly targeted at experts in data analysis in search of insights from unfamiliar datasets. The premise is that most of current learning analytics tools are not designed as explanatory interfaces. This is an area that can lead to important contributions in the areas of learning analytics and information visualisation.
Depending on the trajectory that you take, examples of the questions that such a project could investigate include:
- How can data storytelling elements be automatically added to visualisations of human activity?
- What is the impact of enriching data visualisations with data storytelling elements that communicate insights?
- How can learning theories, heuristics or learning design aspects drive the design of explanatory visualisations?
- How can teachers or facilitators configure the messages to be communicated through explanatory visualisations?
- How can these visualisations and their use be evaluated (e.g. using eye-tracking devices, think-aloud and other sources of evidence)?
- What are the conceptual and pedagogical implications of guiding the user to “one learning story per visualisation,”?
The following paper can serve as an illustrative example of this strand of research:
Exploratory versus Explanatory Visual Learning Analytics: Driving Teachers’ Attention through Educational Data Storytelling. JLA 2018 [PDF]
Opportunity 2: Digital Analytics for classroom proxemics
I am seeking PhD candidates interested in working on designing Learning Analytics innovations to study classroom proxemics by analysing and visualising indoor positioning data (along with other sources of evidence such as audio, physiological activity and characteristics of the students).
This project aims to develop methods for supporting teachers in reflecting on their positioning strategies in the classroom by making key activity traces visible. This project is fundamentally about bridging the gap between substantial work on classroom proxemics, based on qualitative observations; and the dearth of methods to provide feedback to teachers on their teaching practice using evidence, at a scale. This project is strategic because it aims to transform ephemeral teaching classroom activity, that currently is largely opaque to computational analysis, into a transparent phenomenon from which selected features can be captured and rendered visible for the purposes of professional development for teachers.
Depending on the trajectory that you take, examples of the questions that such a project could investigate include:
- How can evidence on classroom proxemics be used to support novice teachers in developing classroom positioning strategies?
- What is the role of the learning design to make sense of classroom proxemics?
- How can indoor positioning and other sources of classroom data be visualised for sense-making?
- What are the potential risks of showing teachers’ positioning data to them and other stakeholders?
- How can indoor positioning data be used to assess or analyse the classroom interior design and furniture arrangements?
- How can positioning data be enriched with physiological, audio and other sources of classroom evidence?
- What kinds of analytics be created to analyse classroom positioning data?
The following paper can serve as an illustrative example of this strand of research:
“I Spent More Time with that Team”: Making Spatial Pedagogy Visible Using Positioning Sensors. LAK 2019 [PDF]
Opportunity 3: Multimodal Teamwork Analytics
I am seeking PhD candidates interested in working on designing and connecting Multimodal Learning Analytics solutions according to the pedagogical needs and contextual constraints of learning occurring across physical and digital spaces.
The learning analytics challenge for this PhD is to research, prototype and evaluate approaches to automatically capture traces of students’ activity, using multimodal analytics techniques to make sense of data from heterogeneous contexts. Depending on the trajectory that you take, examples of the questions that such a project could investigate include:
- How can multimodal analytics approaches be applied to gain a holistic understanding of students’ activity in authentic learning spaces?
- How can the insights of students’ activity in physical spaces be connected with higher-level pedagogies?
- How can these insights promote productive behavioural change?
- How can the teacher be supported with this information to provide informed feedback?
- How can learners and teachers be supported with data in the classroom?
- What are the ethical implications of rolling out analytics in the classroom?
- How can this information support more authentic and holistic assessment?
- What are the technical challenges that need to be overcome?
- How do learning theories and learning design patterns map to the orchestration of such analytics tools?
I would be particularly interested in supervising students focusing on two broad scenarios:
Analytics of the classroom physical space. This would include collecting information via sensors from authentic classrooms and develop mechanisms to analyse the data and communicate insights to teachers, students and or decision makers. The following paper can serve as an illustrative example of this strand of research:
“I Spent More Time with that Team”: Making Spatial Pedagogy Visible Using Positioning Sensors. LAK 2019 [PDF]
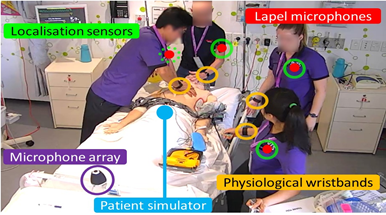
Teamwork analytics. This would involve collecting multimodal data from collocated teamwork settings. I clear example would be teams of nurses training in simulated scenarios. Sensors such as positioning trackers, physiological wristbands, microphones and eye trackers could be used to model complex constructs based on low-level multimodal data. Here’s a paper that illustrates one potential scenario where this research could be applied:
Towards Collaboration Translucence: Giving Meaning to Multimodal Group Data. CHI 2019 [PDF]